EDIT: As you can see, the Fediverse being what it is, it’s basically impossible to get an exact, definitive count, so the numbers will always be a bit fuzzy. But they clearly show trends
I can’t be certain in this case, but the usual suspects are not being connected to as many servers (e.g. not scraping some because of robots.txt settings), delays in scraping the stats, or excluding some servers consciously because their stats are deemed a bit suspicious.


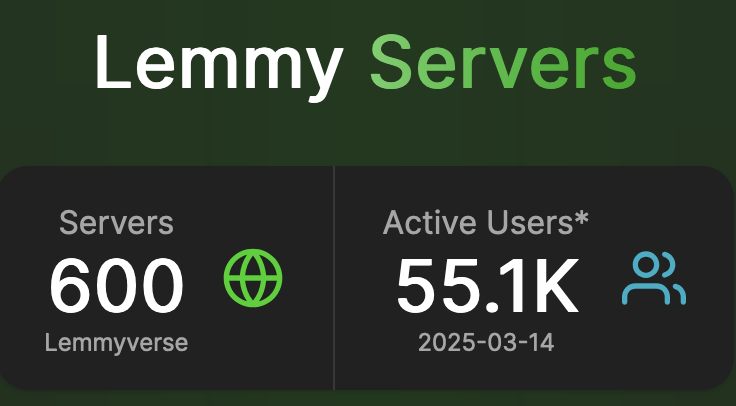
The one shown is from join-lemmy:
https://join-lemmy.org/instances
Also of interest for people that love statistics (which I do):
https://fedidb.org/software/lemmy
https://lemmy.fediverse.observer/stats
EDIT: As you can see, the Fediverse being what it is, it’s basically impossible to get an exact, definitive count, so the numbers will always be a bit fuzzy. But they clearly show trends
Fedidb used to have graphs for lemmy no? Now its only for all fediverse stuff combined :/
It seems like the other two tools only report about 49k MAU, any idea why?
on fediverse observer, you need to switch to daily stats not monthly stats, right now it says 53,225 MAU for March 13th as the latest datapoint
https://lemmy.fediverse.observer/dailystats
fedidb is probably doing something similar, just showing the average for the whole month, instead of the current day
I can’t be certain in this case, but the usual suspects are not being connected to as many servers (e.g. not scraping some because of robots.txt settings), delays in scraping the stats, or excluding some servers consciously because their stats are deemed a bit suspicious.